ssd/san/sas 磁盘 光纤性能比较

ssd/san/sas 磁盘 光纤性能比较

正好有机会用到一个san存储设备,跑了一把性能数据,记录一下
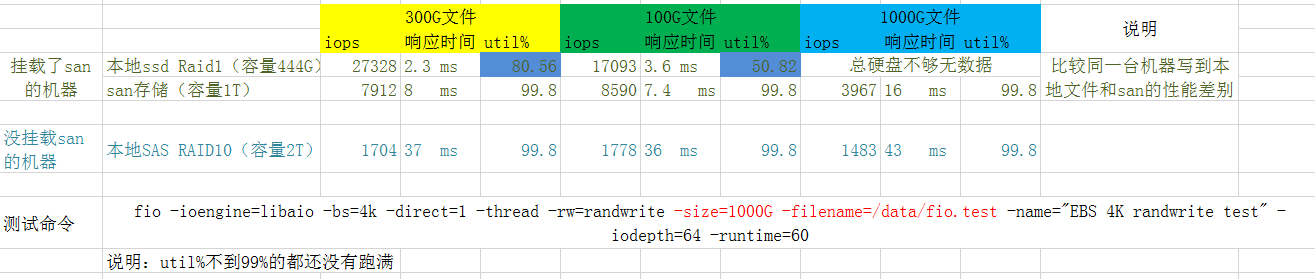
image.png

所使用的测试命令:

1
fio -ioengine=libaio -bs=4k -direct=1 -thread -rw=randwrite -size=1000G -filename=/data/fio.test -name="EBS 4K randwrite test" -iodepth=64 -runtime=60

ssd(Solid State Drive)和san的比较是在同一台物理机上,所以排除了其他因素的干扰。

简要的结论:

  • 本地ssd性能最好、sas机械盘(RAID10)性能最差

  • san存储走特定的光纤网络,不是走tcp的san(至少从网卡看不到san的流量),性能居中

  • 从rt来看 ssd:san:sas 大概是 1:3:15

  • san比本地sas机械盘性能要好,这也许取决于san的网络传输性能和san存储中的设备(比如用的ssd而不是机械盘)

NVMe SSD 和 HDD的性能比较

image.png

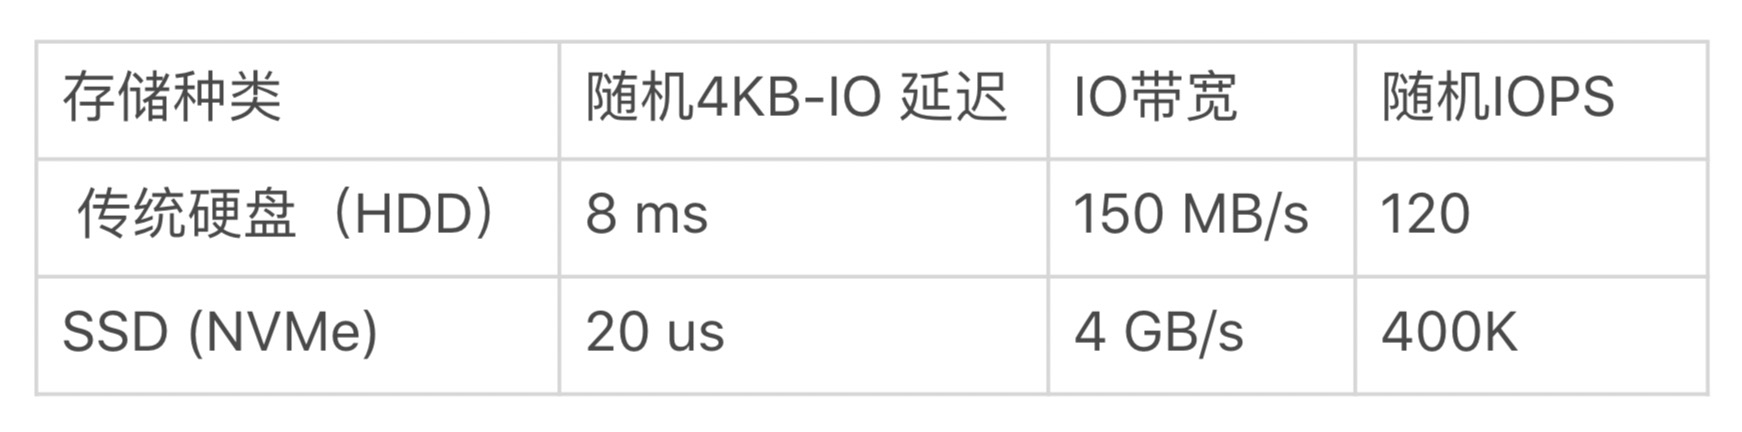
表中性能差异比上面测试还要大,SSD 的随机 IO 延迟比传统硬盘快百倍以上,一般在微妙级别;IO 带宽也高很多倍,可以达到每秒几个 GB;随机 IOPS 更是快了上千倍,可以达到几十万。

HDD只有一个磁头,并发没有意义,但是SSD支持高并发写入读取。SSD没有磁头、不需要旋转,所以随机读取和顺序读取基本没有差别。

SSD 的性能特性和机制

SSD 的内部工作方式和 HDD 大相径庭,我们先了解几个概念。

单元(Cell)、页面(Page)、块(Block)。当今的主流 SSD 是基于 NAND 的,它将数字位存储在单元中。每个 SSD 单元可以存储一位或多位。对单元的每次擦除都会降低单元的寿命,所以单元只能承受一定数量的擦除。单元存储的位数越多,制造成本就越少,SSD 的容量也就越大,但是耐久性(擦除次数)也会降低。

一个页面包括很多单元,典型的页面大小是 4KB,页面也是要读写的最小存储单元。SSD 上没有“重写”操作,不像 HDD 可以直接对任何字节重写覆盖。一个页面一旦写入内容后就不能进行部分重写,必须和其它相邻页面一起被整体擦除重置。

多个页面组合成块。一个块的典型大小为 512KB 或 1MB,也就是大约 128 或 256 页。块是擦除的基本单位,每次擦除都是整个块内的所有页面都被重置。

擦除速度相对很慢,通常为几毫秒。所以对同步的 IO,发出 IO 的应用程序可能会因为块的擦除,而经历很大的写入延迟。为了尽量地减少这样的场景,保持空闲块的阈值对于快速的写响应是很有必要的。SSD 的垃圾回收(GC)的目的就在于此。GC 可以回收用过的块,这样可以确保以后的页写入可以快速分配到一个全新的页。

SSD原理

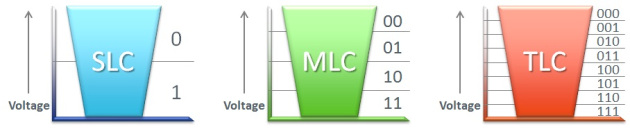
对于 SSD 硬盘,类似SRAM(CPU cache)它是由一个电容加上一个电压计组合在一起,记录了一个或者多个比特。能够记录一个比特很容易理解。给电容里面充上电有电压的时候就是 1,给电容放电里面没有电就是 0。采用这样方式存储数据的 SSD 硬盘,我们一般称之为使用了 SLC 的颗粒,全称是 Single-Level Cell,也就是一个存储单元中只有一位数据。

但是,这样的方式会遇到和 CPU Cache 类似的问题,那就是,同样的面积下,能够存放下的元器件是有限的。如果只用 SLC,我们就会遇到,存储容量上不去,并且价格下不来的问题。于是呢,硬件工程师们就陆续发明了 MLC(Multi-Level Cell)、TLC(Triple-Level Cell)以及 QLC(Quad-Level Cell),也就是能在一个电容里面存下 2 个、3 个乃至 4 个比特。

只有一个电容,我们怎么能够表示更多的比特呢?别忘了,这里我们还有一个电压计。4 个比特一共可以从 0000-1111 表示 16 个不同的数。那么,如果我们能往电容里面充电的时候,充上 15 个不同的电压,并且我们电压计能够区分出这 15 个不同的电压。加上电容被放空代表的 0,就能够代表从 0000-1111 这样 4 个比特了。

不过,要想表示 15 个不同的电压,充电和读取的时候,对于精度的要求就会更高。这会导致充电和读取的时候都更慢,所以 QLC 的 SSD 的读写速度,要比 SLC 的慢上好几倍。

SSD对碎片很敏感,类似JVM的内存碎片需要整理,碎片整理就带来了写入放大。也就是写入空间不够的时候需要先进行碎片整理、搬运,这样写入的数据更大了。

SSD寿命:以Intel 335为例再来算一下,BT用户可以用600TB × 1024 / 843 = 728天,普通用户可以用600TB/2 = 300年!情况十分乐观

两种逻辑门

NAND(NOT-AND) gate

NOR(NOT-OR) gate

如上两种门实现的介质都是非易失存储介质在写入前都需要擦除。实际上NOR Flash的一个bit可以从1变成0,而要从0变1就要擦除整块。NAND flash都需要擦除。

NAND Flash NOR Flash
芯片容量 <32GBit <1GBit
访问方式 块读写(顺序读写) 随机读写
接口方式 任意I/O口 特定完整存储器接口
读写性能 读取快(顺序读) 写入快 擦除快(可按块擦除) 读取快(RAM方式) 写入慢 檫除很慢
使用寿命 百万次 十万次
价格 低廉 高昂

NAND Flash更适合在各类需要大数据的设备中使用,如U盘、SSD、各种存储卡、MP3播放器等,而NOR Flash更适合用在高性能的工业产品中。

高端SSD会选取MLC(Multi-Level Cell)甚至SLC(Single-Level Cell),低端SSD则选取 TLC(Triple-Level Cell)。SD卡一般选取 TLC(Triple-Level Cell)

image-20210603161822079

slc-mlc-tlc-buckets

NOR FLash主要用于:Bios、机顶盒,大小一般是1-32MB

为什么断电后SSD不丢数据

SSD的存储硬件都是NAND Flash。实现原理和通过改变电压,让电子进入绝缘层的浮栅(Floating Gate)内。断电之后,电子仍然在FG里面。但是如果长时间不通电,比如几年,仍然可能会丢数据。所以换句话说,SSD的确也不适合作为冷数据备份。

比如标准要求SSD:温度在30度的情况下,数据要能保持52周。

写入放大(Write Amplification, or WA)

这是 SSD 相对于 HDD 的一个缺点,即实际写入 SSD 的物理数据量,有可能是应用层写入数据量的多倍。一方面,页级别的写入需要移动已有的数据来腾空页面。另一方面,GC 的操作也会移动用户数据来进行块级别的擦除。所以对 SSD 真正的写操作的数据可能比实际写的数据量大,这就是写入放大。一块 SSD 只能进行有限的擦除次数,也称为编程 / 擦除(P/E)周期,所以写入放大效用会缩短 SSD 的寿命。

SSD 的读取和写入的基本单位,不是一个比特(bit)或者一个字节(byte),而是一个页(Page)。SSD 的擦除单位就更夸张了,我们不仅不能按照比特或者字节来擦除,连按照页来擦除都不行,我们必须按照块来擦除。

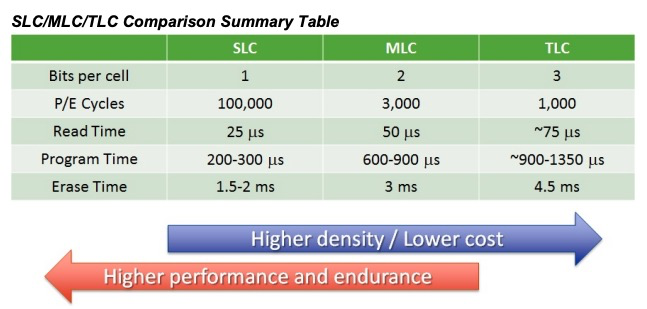
SLC 的芯片,可以擦除的次数大概在 10 万次,MLC 就在 1 万次左右,而 TLC 和 QLC 就只在几千次了。这也是为什么,你去购买 SSD 硬盘,会看到同样的容量的价格差别很大,因为它们的芯片颗粒和寿命完全不一样。

耗损平衡 (Wear Leveling)

对每一个块而言,一旦达到最大数量,该块就会死亡。对于 SLC 块,P/E 周期的典型数目是十万次;对于 MLC 块,P/E 周期的数目是一万;而对于 TLC 块,则可能是几千。为了确保 SSD 的容量和性能,我们需要在擦除次数上保持平衡,SSD 控制器具有这种“耗损平衡”机制可以实现这一目标。在损耗平衡期间,数据在各个块之间移动,以实现均衡的损耗,这种机制也会对前面讲的写入放大推波助澜。

磁盘类型查看

1
2
3
4
5
$cat /sys/block/vda/queue/rotational
1 //1表示旋转,非ssd,0表示ssd
或者
lsblk -d -o name,rota

fio测试

以下是两块测试的SSD磁盘测试前的基本情况

1
2
3
4
5
6
7
8
9
10
11
12
13
14
15
16
17
18
19
20
21
22
23
24
25
26
27
28
29
30
31
32
33
34
35
/dev/sda 240.06G SSD_SATA //sata
/dev/sfd0n1 3200G SSD_PCIE //PCIE
Filesystem Size Used Avail Use% Mounted on
/dev/sda3 49G 29G 18G 63% /
/dev/sfdv0n1p1 2.0T 803G 1.3T 40% /data
# cat /sys/block/sda/queue/rotational
0
# cat /sys/block/sfdv0n1/queue/rotational
0
#测试前的iostat状态
# iostat -d sfdv0n1 sda3 1 -x
Linux 3.10.0-957.el7.x86_64 (nu4d01142.sqa.nu8) 2021年02月23日 _x86_64_ (104 CPU)
Device: rrqm/s wrqm/s r/s w/s rkB/s wkB/s avgrq-sz avgqu-sz await r_await w_await svctm %util
sda3 0.00 10.67 1.24 18.78 7.82 220.69 22.83 0.03 1.64 1.39 1.66 0.08 0.17
sfdv0n1 0.00 0.21 9.91 841.42 128.15 8237.10 19.65 0.93 0.04 0.25 0.04 1.05 89.52
Device: rrqm/s wrqm/s r/s w/s rkB/s wkB/s avgrq-sz avgqu-sz await r_await w_await svctm %util
sda3 0.00 15.00 0.00 17.00 0.00 136.00 16.00 0.03 2.00 0.00 2.00 1.29 2.20
sfdv0n1 0.00 0.00 0.00 11158.00 0.00 54448.00 9.76 1.03 0.02 0.00 0.02 0.09 100.00
Device: rrqm/s wrqm/s r/s w/s rkB/s wkB/s avgrq-sz avgqu-sz await r_await w_await svctm %util
sda3 0.00 5.00 0.00 18.00 0.00 104.00 11.56 0.01 0.61 0.00 0.61 0.61 1.10
sfdv0n1 0.00 0.00 0.00 10970.00 0.00 53216.00 9.70 1.02 0.03 0.00 0.03 0.09 100.10
Device: rrqm/s wrqm/s r/s w/s rkB/s wkB/s avgrq-sz avgqu-sz await r_await w_await svctm %util
sda3 0.00 0.00 0.00 24.00 0.00 100.00 8.33 0.01 0.58 0.00 0.58 0.08 0.20
sfdv0n1 0.00 0.00 0.00 11206.00 0.00 54476.00 9.72 1.03 0.03 0.00 0.03 0.09 99.90
Device: rrqm/s wrqm/s r/s w/s rkB/s wkB/s avgrq-sz avgqu-sz await r_await w_await svctm %util
sda3 0.00 14.00 0.00 21.00 0.00 148.00 14.10 0.01 0.48 0.00 0.48 0.33 0.70
sfdv0n1 0.00 0.00 0.00 10071.00 0.00 49028.00 9.74 1.02 0.03 0.00 0.03 0.10 99.80

NVMe SSD测试数据

对一块ssd进行如下测试(挂载在/data 目录)

1
2
3
4
5
6
7
8
9
10
11
12
13
14
15
16
17
18
19
20
21
22
23
24
25
26
27
28
29
30
31
32
33
34
fio -ioengine=libaio -bs=4k -direct=1 -thread -rw=randwrite -rwmixread=70 -size=16G -filename=/data/fio.test -name="EBS 4K randwrite test" -iodepth=64 -runtime=60
EBS 4K randwrite test: (g=0): rw=randwrite, bs=(R) 4096B-4096B, (W) 4096B-4096B, (T) 4096B-4096B, ioengine=libaio, iodepth=64
fio-3.7
Starting 1 thread
EBS 4K randwrite test: Laying out IO file (1 file / 16384MiB)
Jobs: 1 (f=1): [w(1)][100.0%][r=0KiB/s,w=63.8MiB/s][r=0,w=16.3k IOPS][eta 00m:00s]
EBS 4K randwrite test: (groupid=0, jobs=1): err= 0: pid=258871: Tue Feb 23 14:12:23 2021
write: IOPS=18.9k, BW=74.0MiB/s (77.6MB/s)(4441MiB/60001msec)
slat (usec): min=4, max=6154, avg=48.82, stdev=56.38
clat (nsec): min=1049, max=12360k, avg=3326362.62, stdev=920683.43
lat (usec): min=68, max=12414, avg=3375.52, stdev=928.97
clat percentiles (usec):
| 1.00th=[ 1483], 5.00th=[ 1811], 10.00th=[ 2114], 20.00th=[ 2376],
| 30.00th=[ 2704], 40.00th=[ 3130], 50.00th=[ 3523], 60.00th=[ 3785],
| 70.00th=[ 3949], 80.00th=[ 4080], 90.00th=[ 4293], 95.00th=[ 4490],
| 99.00th=[ 5604], 99.50th=[ 5997], 99.90th=[ 7111], 99.95th=[ 7832],
| 99.99th=[ 9634]
bw ( KiB/s): min=61024, max=118256, per=99.98%, avg=75779.58, stdev=12747.95, samples=120
iops : min=15256, max=29564, avg=18944.88, stdev=3186.97, samples=120
lat (usec) : 2=0.01%, 100=0.01%, 250=0.01%, 500=0.01%, 750=0.02%
lat (usec) : 1000=0.06%
lat (msec) : 2=7.40%, 4=66.19%, 10=26.32%, 20=0.01%
cpu : usr=5.23%, sys=46.71%, ctx=846953, majf=0, minf=6
IO depths : 1=0.1%, 2=0.1%, 4=0.1%, 8=0.1%, 16=0.1%, 32=0.1%, >=64=100.0%
submit : 0=0.0%, 4=100.0%, 8=0.0%, 16=0.0%, 32=0.0%, 64=0.0%, >=64=0.0%
complete : 0=0.0%, 4=100.0%, 8=0.0%, 16=0.0%, 32=0.0%, 64=0.1%, >=64=0.0%
issued rwts: total=0,1136905,0,0 short=0,0,0,0 dropped=0,0,0,0
latency : target=0, window=0, percentile=100.00%, depth=64
Run status group 0 (all jobs):
WRITE: bw=74.0MiB/s (77.6MB/s), 74.0MiB/s-74.0MiB/s (77.6MB/s-77.6MB/s), io=4441MiB (4657MB), run=60001-60001msec
Disk stats (read/write):
sfdv0n1: ios=0/1821771, merge=0/7335, ticks=0/39708, in_queue=78295, util=100.00%

slat (usec): min=4, max=6154, avg=48.82, stdev=56.38: The first latency metric you’ll see is the ‘slat’ or submission latency. It is pretty much what it sounds like, meaning “how long did it take to submit this IO to the kernel for processing?”

如上测试iops为:18944,测试期间的iostat,测试中一直有mysql在导入数据,所以测试开始前util就已经100%了,并且w/s到了13K左右

1
2
3
4
5
6
7
8
9
10
11
12
13
14
15
16
17
18
19
20
21
22
23
24
25
26
27
# iostat -d sfdv0n1 3 -x
Linux 3.10.0-957.el7.x86_64 (nu4d01142.sqa.nu8) 2021年02月23日 _x86_64_ (104 CPU)
Device: rrqm/s wrqm/s r/s w/s rkB/s wkB/s avgrq-sz avgqu-sz await r_await w_await svctm %util
sfdv0n1 0.00 0.18 3.45 769.17 102.83 7885.16 20.68 0.93 0.04 0.26 0.04 1.16 89.46
Device: rrqm/s wrqm/s r/s w/s rkB/s wkB/s avgrq-sz avgqu-sz await r_await w_await svctm %util
sfdv0n1 0.00 0.00 0.00 13168.67 0.00 66244.00 10.06 1.05 0.03 0.00 0.03 0.08 100.10
Device: rrqm/s wrqm/s r/s w/s rkB/s wkB/s avgrq-sz avgqu-sz await r_await w_await svctm %util
sfdv0n1 0.00 0.00 0.00 12822.67 0.00 65542.67 10.22 1.04 0.02 0.00 0.02 0.08 100.07
//增加压力
Device: rrqm/s wrqm/s r/s w/s rkB/s wkB/s avgrq-sz avgqu-sz await r_await w_await svctm %util
sfdv0n1 0.00 0.00 0.00 27348.33 0.00 214928.00 15.72 1.27 0.02 0.00 0.02 0.04 100.17
Device: rrqm/s wrqm/s r/s w/s rkB/s wkB/s avgrq-sz avgqu-sz await r_await w_await svctm %util
sfdv0n1 0.00 1.00 0.00 32661.67 0.00 271660.00 16.63 1.32 0.02 0.00 0.02 0.03 100.37
Device: rrqm/s wrqm/s r/s w/s rkB/s wkB/s avgrq-sz avgqu-sz await r_await w_await svctm %util
sfdv0n1 0.00 0.00 0.00 31645.00 0.00 265988.00 16.81 1.33 0.02 0.00 0.02 0.03 100.37
Device: rrqm/s wrqm/s r/s w/s rkB/s wkB/s avgrq-sz avgqu-sz await r_await w_await svctm %util
sfdv0n1 0.00 574.00 0.00 31961.67 0.00 271094.67 16.96 1.36 0.02 0.00 0.02 0.03 100.13
Device: rrqm/s wrqm/s r/s w/s rkB/s wkB/s avgrq-sz avgqu-sz await r_await w_await svctm %util
sfdv0n1 0.00 0.00 0.00 27656.33 0.00 224586.67 16.24 1.28 0.02 0.00 0.02 0.04 100.37

从iostat看出,测试开始前util已经100%(因为ssd,util失去参考意义),w/s 13K左右,压力跑起来后w/s能到30K,svctm、await均保持稳定

SSD的direct和buffered似乎很奇怪,应该是direct=0性能更好,实际不是这样,这里还需要找资料求证下

  • direct``=bool

    If value is true, use non-buffered I/O. This is usually O_DIRECT. Note that OpenBSD and ZFS on Solaris don’t support direct I/O. On Windows the synchronous ioengines don’t support direct I/O. Default: false.

  • buffered``=bool

    If value is true, use buffered I/O. This is the opposite of the direct option. Defaults to true.

如下测试中direct=1和direct=0的write avg iops分别为42K、16K

1
2
3
4
5
6
7
8
9
10
11
12
13
14
15
16
17
18
19
20
21
22
23
24
25
26
27
28
29
30
31
32
33
34
35
36
37
38
39
40
41
42
43
44
45
46
47
48
49
50
51
52
53
54
55
56
57
58
59
60
61
62
63
64
65
66
67
68
69
70
71
72
73
74
75
76
77
78
79
80
81
82
83
84
85
86
87
88
89
90
91
92
93
94
# fio -ioengine=libaio -bs=4k -direct=1 -buffered=0 -thread -rw=randrw -rwmixread=70 -size=16G -filename=/data/fio.test -name="EBS 4K randwrite test" -iodepth=64 -runtime=60
EBS 4K randwrite test: (g=0): rw=randrw, bs=(R) 4096B-4096B, (W) 4096B-4096B, (T) 4096B-4096B, ioengine=libaio, iodepth=64
fio-3.7
Starting 1 thread
Jobs: 1 (f=1): [m(1)][100.0%][r=507MiB/s,w=216MiB/s][r=130k,w=55.2k IOPS][eta 00m:00s]
EBS 4K randwrite test: (groupid=0, jobs=1): err= 0: pid=415921: Tue Feb 23 14:34:33 2021
read: IOPS=99.8k, BW=390MiB/s (409MB/s)(11.2GiB/29432msec)
slat (nsec): min=1043, max=917837, avg=4273.86, stdev=3792.17
clat (usec): min=2, max=4313, avg=459.80, stdev=239.61
lat (usec): min=4, max=4328, avg=464.16, stdev=241.81
clat percentiles (usec):
| 1.00th=[ 251], 5.00th=[ 277], 10.00th=[ 289], 20.00th=[ 310],
| 30.00th=[ 326], 40.00th=[ 343], 50.00th=[ 363], 60.00th=[ 400],
| 70.00th=[ 502], 80.00th=[ 603], 90.00th=[ 750], 95.00th=[ 881],
| 99.00th=[ 1172], 99.50th=[ 1401], 99.90th=[ 3032], 99.95th=[ 3359],
| 99.99th=[ 3785]
bw ( KiB/s): min=182520, max=574856, per=99.24%, avg=395975.64, stdev=119541.78, samples=58
iops : min=45630, max=143714, avg=98993.90, stdev=29885.42, samples=58
write: IOPS=42.8k, BW=167MiB/s (175MB/s)(4915MiB/29432msec)
slat (usec): min=3, max=263, avg= 9.34, stdev= 4.35
clat (usec): min=14, max=2057, avg=402.26, stdev=140.67
lat (usec): min=19, max=2070, avg=411.72, stdev=142.67
clat percentiles (usec):
| 1.00th=[ 237], 5.00th=[ 281], 10.00th=[ 293], 20.00th=[ 314],
| 30.00th=[ 330], 40.00th=[ 343], 50.00th=[ 359], 60.00th=[ 379],
| 70.00th=[ 404], 80.00th=[ 457], 90.00th=[ 586], 95.00th=[ 717],
| 99.00th=[ 930], 99.50th=[ 1004], 99.90th=[ 1254], 99.95th=[ 1385],
| 99.99th=[ 1532]
bw ( KiB/s): min=78104, max=244408, per=99.22%, avg=169671.52, stdev=51142.10, samples=58
iops : min=19526, max=61102, avg=42417.86, stdev=12785.51, samples=58
lat (usec) : 4=0.01%, 10=0.01%, 20=0.01%, 50=0.02%, 100=0.04%
lat (usec) : 250=1.02%, 500=73.32%, 750=17.28%, 1000=6.30%
lat (msec) : 2=1.83%, 4=0.19%, 10=0.01%
cpu : usr=15.84%, sys=83.31%, ctx=13765, majf=0, minf=7
IO depths : 1=0.1%, 2=0.1%, 4=0.1%, 8=0.1%, 16=0.1%, 32=0.1%, >=64=100.0%
submit : 0=0.0%, 4=100.0%, 8=0.0%, 16=0.0%, 32=0.0%, 64=0.0%, >=64=0.0%
complete : 0=0.0%, 4=100.0%, 8=0.0%, 16=0.0%, 32=0.0%, 64=0.1%, >=64=0.0%
issued rwts: total=2936000,1258304,0,0 short=0,0,0,0 dropped=0,0,0,0
latency : target=0, window=0, percentile=100.00%, depth=64
Run status group 0 (all jobs):
READ: bw=390MiB/s (409MB/s), 390MiB/s-390MiB/s (409MB/s-409MB/s), io=11.2GiB (12.0GB), run=29432-29432msec
WRITE: bw=167MiB/s (175MB/s), 167MiB/s-167MiB/s (175MB/s-175MB/s), io=4915MiB (5154MB), run=29432-29432msec
Disk stats (read/write):
sfdv0n1: ios=795793/1618341, merge=0/11, ticks=218710/27721, in_queue=264935, util=100.00%
[root@nu4d01142 data]#
[root@nu4d01142 data]# fio -ioengine=libaio -bs=4k -direct=0 -buffered=0 -thread -rw=randrw -rwmixread=70 -size=6G -filename=/data/fio.test -name="EBS 4K randwrite test" -iodepth=64 -runtime=60
EBS 4K randwrite test: (g=0): rw=randrw, bs=(R) 4096B-4096B, (W) 4096B-4096B, (T) 4096B-4096B, ioengine=libaio, iodepth=64
fio-3.7
Starting 1 thread
Jobs: 1 (f=1): [m(1)][100.0%][r=124MiB/s,w=53.5MiB/s][r=31.7k,w=13.7k IOPS][eta 00m:00s]
EBS 4K randwrite test: (groupid=0, jobs=1): err= 0: pid=437523: Tue Feb 23 14:37:54 2021
read: IOPS=38.6k, BW=151MiB/s (158MB/s)(4300MiB/28550msec)
slat (nsec): min=1205, max=1826.7k, avg=13253.36, stdev=17173.87
clat (nsec): min=236, max=5816.8k, avg=1135969.25, stdev=337142.34
lat (nsec): min=1977, max=5831.2k, avg=1149404.84, stdev=341232.87
clat percentiles (usec):
| 1.00th=[ 461], 5.00th=[ 627], 10.00th=[ 717], 20.00th=[ 840],
| 30.00th=[ 938], 40.00th=[ 1029], 50.00th=[ 1123], 60.00th=[ 1221],
| 70.00th=[ 1319], 80.00th=[ 1434], 90.00th=[ 1565], 95.00th=[ 1680],
| 99.00th=[ 1893], 99.50th=[ 1975], 99.90th=[ 2671], 99.95th=[ 3261],
| 99.99th=[ 3851]
bw ( KiB/s): min=119304, max=216648, per=100.00%, avg=154273.07, stdev=29925.10, samples=57
iops : min=29826, max=54162, avg=38568.25, stdev=7481.30, samples=57
write: IOPS=16.5k, BW=64.6MiB/s (67.7MB/s)(1844MiB/28550msec)
slat (usec): min=3, max=3565, avg=21.07, stdev=22.23
clat (usec): min=14, max=9983, avg=1164.21, stdev=459.66
lat (usec): min=21, max=10011, avg=1185.57, stdev=463.28
clat percentiles (usec):
| 1.00th=[ 498], 5.00th=[ 619], 10.00th=[ 709], 20.00th=[ 832],
| 30.00th=[ 930], 40.00th=[ 1020], 50.00th=[ 1123], 60.00th=[ 1237],
| 70.00th=[ 1336], 80.00th=[ 1450], 90.00th=[ 1598], 95.00th=[ 1713],
| 99.00th=[ 2311], 99.50th=[ 3851], 99.90th=[ 5932], 99.95th=[ 6456],
| 99.99th=[ 7701]
bw ( KiB/s): min=50800, max=92328, per=100.00%, avg=66128.47, stdev=12890.64, samples=57
iops : min=12700, max=23082, avg=16532.07, stdev=3222.66, samples=57
lat (nsec) : 250=0.01%, 500=0.01%, 750=0.01%, 1000=0.01%
lat (usec) : 2=0.01%, 4=0.01%, 10=0.01%, 20=0.02%, 50=0.03%
lat (usec) : 100=0.04%, 250=0.18%, 500=1.01%, 750=11.05%, 1000=25.02%
lat (msec) : 2=61.87%, 4=0.62%, 10=0.14%
cpu : usr=10.87%, sys=61.98%, ctx=218415, majf=0, minf=7
IO depths : 1=0.1%, 2=0.1%, 4=0.1%, 8=0.1%, 16=0.1%, 32=0.1%, >=64=100.0%
submit : 0=0.0%, 4=100.0%, 8=0.0%, 16=0.0%, 32=0.0%, 64=0.0%, >=64=0.0%
complete : 0=0.0%, 4=100.0%, 8=0.0%, 16=0.0%, 32=0.0%, 64=0.1%, >=64=0.0%
issued rwts: total=1100924,471940,0,0 short=0,0,0,0 dropped=0,0,0,0
latency : target=0, window=0, percentile=100.00%, depth=64
Run status group 0 (all jobs):
READ: bw=151MiB/s (158MB/s), 151MiB/s-151MiB/s (158MB/s-158MB/s), io=4300MiB (4509MB), run=28550-28550msec
WRITE: bw=64.6MiB/s (67.7MB/s), 64.6MiB/s-64.6MiB/s (67.7MB/s-67.7MB/s), io=1844MiB (1933MB), run=28550-28550msec
Disk stats (read/write):
sfdv0n1: ios=536103/822037, merge=0/1442, ticks=66507/17141, in_queue=99429, util=100.00%

SATA SSD测试数据

1
2
3
4
5
6
# cat /sys/block/sda/queue/rotational
0
# lsblk -d -o name,rota
NAME ROTA
sda 0
sfdv0n1 0

-direct=0 -buffered=0读写iops分别为15.8K、6.8K 比ssd差了不少(都是direct=0),如果direct、buffered都是1的话,ESSD性能很差,读写iops分别为4312、1852

1
2
3
4
5
6
7
8
9
10
11
12
13
14
15
16
17
18
19
20
21
22
23
24
25
26
27
28
29
30
31
32
33
34
35
36
37
38
39
40
41
42
43
44
45
46
47
48
49
50
51
52
53
54
55
56
57
58
59
60
61
62
63
64
65
66
67
68
69
70
71
72
73
74
75
76
77
78
79
80
81
82
83
84
85
86
87
88
89
90
91
92
93
94
95
96
97
98
99
100
101
102
103
104
105
106
107
108
109
110
111
112
113
114
115
116
117
118
119
120
121
122
123
124
125
126
127
128
129
130
131
132
133
134
135
136
137
138
139
# fio -ioengine=libaio -bs=4k -direct=0 -buffered=0 -thread -rw=randrw -rwmixread=70 -size=2G -filename=/var/lib/docker/fio.test -name="EBS 4K randwrite test" -iodepth=64 -runtime=60
EBS 4K randwrite test: (g=0): rw=randrw, bs=(R) 4096B-4096B, (W) 4096B-4096B, (T) 4096B-4096B, ioengine=libaio, iodepth=64
fio-3.7
Starting 1 thread
EBS 4K randwrite test: Laying out IO file (1 file / 2048MiB)
Jobs: 1 (f=1): [m(1)][100.0%][r=68.7MiB/s,w=29.7MiB/s][r=17.6k,w=7594 IOPS][eta 00m:00s]
EBS 4K randwrite test: (groupid=0, jobs=1): err= 0: pid=13261: Tue Feb 23 14:42:41 2021
read: IOPS=15.8k, BW=61.8MiB/s (64.8MB/s)(1432MiB/23172msec)
slat (nsec): min=1266, max=7261.0k, avg=7101.88, stdev=20655.54
clat (usec): min=167, max=27670, avg=2832.68, stdev=1786.18
lat (usec): min=175, max=27674, avg=2839.93, stdev=1784.42
clat percentiles (usec):
| 1.00th=[ 437], 5.00th=[ 668], 10.00th=[ 873], 20.00th=[ 988],
| 30.00th=[ 1401], 40.00th=[ 2442], 50.00th=[ 2835], 60.00th=[ 3195],
| 70.00th=[ 3523], 80.00th=[ 4047], 90.00th=[ 5014], 95.00th=[ 5866],
| 99.00th=[ 8160], 99.50th=[ 9372], 99.90th=[13829], 99.95th=[15008],
| 99.99th=[23725]
bw ( KiB/s): min=44183, max=149440, per=99.28%, avg=62836.17, stdev=26590.84, samples=46
iops : min=11045, max=37360, avg=15709.02, stdev=6647.72, samples=46
write: IOPS=6803, BW=26.6MiB/s (27.9MB/s)(616MiB/23172msec)
slat (nsec): min=1566, max=11474k, avg=8460.17, stdev=38221.51
clat (usec): min=77, max=24047, avg=2789.68, stdev=2042.55
lat (usec): min=80, max=24054, avg=2798.29, stdev=2040.85
clat percentiles (usec):
| 1.00th=[ 265], 5.00th=[ 433], 10.00th=[ 635], 20.00th=[ 840],
| 30.00th=[ 979], 40.00th=[ 2212], 50.00th=[ 2671], 60.00th=[ 3130],
| 70.00th=[ 3523], 80.00th=[ 4228], 90.00th=[ 5342], 95.00th=[ 6456],
| 99.00th=[ 9241], 99.50th=[10421], 99.90th=[13960], 99.95th=[15533],
| 99.99th=[23725]
bw ( KiB/s): min=18435, max=63112, per=99.26%, avg=27012.57, stdev=11299.42, samples=46
iops : min= 4608, max=15778, avg=6753.11, stdev=2824.87, samples=46
lat (usec) : 100=0.01%, 250=0.23%, 500=3.14%, 750=5.46%, 1000=15.27%
lat (msec) : 2=11.47%, 4=43.09%, 10=20.88%, 20=0.44%, 50=0.01%
cpu : usr=3.53%, sys=18.08%, ctx=47448, majf=0, minf=6
IO depths : 1=0.1%, 2=0.1%, 4=0.1%, 8=0.1%, 16=0.1%, 32=0.1%, >=64=100.0%
submit : 0=0.0%, 4=100.0%, 8=0.0%, 16=0.0%, 32=0.0%, 64=0.0%, >=64=0.0%
complete : 0=0.0%, 4=100.0%, 8=0.0%, 16=0.0%, 32=0.0%, 64=0.1%, >=64=0.0%
issued rwts: total=366638,157650,0,0 short=0,0,0,0 dropped=0,0,0,0
latency : target=0, window=0, percentile=100.00%, depth=64
Run status group 0 (all jobs):
READ: bw=61.8MiB/s (64.8MB/s), 61.8MiB/s-61.8MiB/s (64.8MB/s-64.8MB/s), io=1432MiB (1502MB), run=23172-23172msec
WRITE: bw=26.6MiB/s (27.9MB/s), 26.6MiB/s-26.6MiB/s (27.9MB/s-27.9MB/s), io=616MiB (646MB), run=23172-23172msec
Disk stats (read/write):
sda: ios=359202/155123, merge=299/377, ticks=946305/407820, in_queue=1354596, util=99.61%
# fio -ioengine=libaio -bs=4k -direct=1 -buffered=0 -thread -rw=randrw -rwmixread=70 -size=2G -filename=/var/lib/docker/fio.test -name="EBS 4K randwrite test" -iodepth=64 -runtime=60
EBS 4K randwrite test: (g=0): rw=randrw, bs=(R) 4096B-4096B, (W) 4096B-4096B, (T) 4096B-4096B, ioengine=libaio, iodepth=64
fio-3.7
Starting 1 thread
Jobs: 1 (f=1): [m(1)][95.5%][r=57.8MiB/s,w=25.7MiB/s][r=14.8k,w=6568 IOPS][eta 00m:01s]
EBS 4K randwrite test: (groupid=0, jobs=1): err= 0: pid=26167: Tue Feb 23 14:44:40 2021
read: IOPS=16.9k, BW=65.9MiB/s (69.1MB/s)(1432MiB/21730msec)
slat (nsec): min=1312, max=4454.2k, avg=8489.99, stdev=15763.97
clat (usec): min=201, max=18856, avg=2679.38, stdev=1720.02
lat (usec): min=206, max=18860, avg=2688.03, stdev=1717.19
clat percentiles (usec):
| 1.00th=[ 635], 5.00th=[ 832], 10.00th=[ 914], 20.00th=[ 971],
| 30.00th=[ 1090], 40.00th=[ 2114], 50.00th=[ 2704], 60.00th=[ 3064],
| 70.00th=[ 3392], 80.00th=[ 3851], 90.00th=[ 4817], 95.00th=[ 5735],
| 99.00th=[ 7767], 99.50th=[ 8979], 99.90th=[13698], 99.95th=[15139],
| 99.99th=[16581]
bw ( KiB/s): min=45168, max=127528, per=100.00%, avg=67625.19, stdev=26620.82, samples=43
iops : min=11292, max=31882, avg=16906.28, stdev=6655.20, samples=43
write: IOPS=7254, BW=28.3MiB/s (29.7MB/s)(616MiB/21730msec)
slat (nsec): min=1749, max=3412.2k, avg=9816.22, stdev=14501.05
clat (usec): min=97, max=23473, avg=2556.02, stdev=1980.53
lat (usec): min=107, max=23477, avg=2566.01, stdev=1977.65
clat percentiles (usec):
| 1.00th=[ 277], 5.00th=[ 486], 10.00th=[ 693], 20.00th=[ 824],
| 30.00th=[ 881], 40.00th=[ 1205], 50.00th=[ 2442], 60.00th=[ 2868],
| 70.00th=[ 3326], 80.00th=[ 3949], 90.00th=[ 5080], 95.00th=[ 6128],
| 99.00th=[ 8717], 99.50th=[10159], 99.90th=[14484], 99.95th=[15926],
| 99.99th=[18744]
bw ( KiB/s): min=19360, max=55040, per=100.00%, avg=29064.05, stdev=11373.59, samples=43
iops : min= 4840, max=13760, avg=7266.00, stdev=2843.41, samples=43
lat (usec) : 100=0.01%, 250=0.17%, 500=1.66%, 750=3.74%, 1000=22.57%
lat (msec) : 2=12.66%, 4=40.62%, 10=18.20%, 20=0.38%, 50=0.01%
cpu : usr=4.17%, sys=22.27%, ctx=14314, majf=0, minf=7
IO depths : 1=0.1%, 2=0.1%, 4=0.1%, 8=0.1%, 16=0.1%, 32=0.1%, >=64=100.0%
submit : 0=0.0%, 4=100.0%, 8=0.0%, 16=0.0%, 32=0.0%, 64=0.0%, >=64=0.0%
complete : 0=0.0%, 4=100.0%, 8=0.0%, 16=0.0%, 32=0.0%, 64=0.1%, >=64=0.0%
issued rwts: total=366638,157650,0,0 short=0,0,0,0 dropped=0,0,0,0
latency : target=0, window=0, percentile=100.00%, depth=64
Run status group 0 (all jobs):
READ: bw=65.9MiB/s (69.1MB/s), 65.9MiB/s-65.9MiB/s (69.1MB/s-69.1MB/s), io=1432MiB (1502MB), run=21730-21730msec
WRITE: bw=28.3MiB/s (29.7MB/s), 28.3MiB/s-28.3MiB/s (29.7MB/s-29.7MB/s), io=616MiB (646MB), run=21730-21730msec
Disk stats (read/write):
sda: ios=364744/157621, merge=779/473, ticks=851759/352008, in_queue=1204024, util=99.61%
# fio -ioengine=libaio -bs=4k -direct=1 -buffered=1 -thread -rw=randrw -rwmixread=70 -size=2G -filename=/var/lib/docker/fio.test -name="EBS 4K randwrite test" -iodepth=64 -runtime=60
EBS 4K randwrite test: (g=0): rw=randrw, bs=(R) 4096B-4096B, (W) 4096B-4096B, (T) 4096B-4096B, ioengine=libaio, iodepth=64
fio-3.7
Starting 1 thread
Jobs: 1 (f=1): [m(1)][100.0%][r=15.9MiB/s,w=7308KiB/s][r=4081,w=1827 IOPS][eta 00m:00s]
EBS 4K randwrite test: (groupid=0, jobs=1): err= 0: pid=31560: Tue Feb 23 14:46:10 2021
read: IOPS=4312, BW=16.8MiB/s (17.7MB/s)(1011MiB/60001msec)
slat (usec): min=63, max=14320, avg=216.76, stdev=430.61
clat (usec): min=5, max=778861, avg=10254.92, stdev=22345.40
lat (usec): min=1900, max=782277, avg=10472.16, stdev=22657.06
clat percentiles (msec):
| 1.00th=[ 6], 5.00th=[ 6], 10.00th=[ 6], 20.00th=[ 7],
| 30.00th=[ 7], 40.00th=[ 7], 50.00th=[ 7], 60.00th=[ 7],
| 70.00th=[ 8], 80.00th=[ 8], 90.00th=[ 8], 95.00th=[ 11],
| 99.00th=[ 107], 99.50th=[ 113], 99.90th=[ 132], 99.95th=[ 197],
| 99.99th=[ 760]
bw ( KiB/s): min= 168, max=29784, per=100.00%, avg=17390.92, stdev=10932.90, samples=119
iops : min= 42, max= 7446, avg=4347.71, stdev=2733.21, samples=119
write: IOPS=1852, BW=7410KiB/s (7588kB/s)(434MiB/60001msec)
slat (usec): min=3, max=666432, avg=23.59, stdev=2745.39
clat (msec): min=3, max=781, avg=10.14, stdev=20.50
lat (msec): min=3, max=781, avg=10.16, stdev=20.72
clat percentiles (msec):
| 1.00th=[ 6], 5.00th=[ 6], 10.00th=[ 6], 20.00th=[ 7],
| 30.00th=[ 7], 40.00th=[ 7], 50.00th=[ 7], 60.00th=[ 7],
| 70.00th=[ 7], 80.00th=[ 8], 90.00th=[ 8], 95.00th=[ 11],
| 99.00th=[ 107], 99.50th=[ 113], 99.90th=[ 131], 99.95th=[ 157],
| 99.99th=[ 760]
bw ( KiB/s): min= 80, max=12328, per=100.00%, avg=7469.53, stdev=4696.69, samples=119
iops : min= 20, max= 3082, avg=1867.34, stdev=1174.19, samples=119
lat (usec) : 10=0.01%
lat (msec) : 2=0.01%, 4=0.01%, 10=94.64%, 20=1.78%, 50=0.11%
lat (msec) : 100=1.80%, 250=1.63%, 500=0.01%, 750=0.02%, 1000=0.01%
cpu : usr=2.51%, sys=10.98%, ctx=260210, majf=0, minf=7
IO depths : 1=0.1%, 2=0.1%, 4=0.1%, 8=0.1%, 16=0.1%, 32=0.1%, >=64=100.0%
submit : 0=0.0%, 4=100.0%, 8=0.0%, 16=0.0%, 32=0.0%, 64=0.0%, >=64=0.0%
complete : 0=0.0%, 4=100.0%, 8=0.0%, 16=0.0%, 32=0.0%, 64=0.1%, >=64=0.0%
issued rwts: total=258768,111147,0,0 short=0,0,0,0 dropped=0,0,0,0
latency : target=0, window=0, percentile=100.00%, depth=64
Run status group 0 (all jobs):
READ: bw=16.8MiB/s (17.7MB/s), 16.8MiB/s-16.8MiB/s (17.7MB/s-17.7MB/s), io=1011MiB (1060MB), run=60001-60001msec
WRITE: bw=7410KiB/s (7588kB/s), 7410KiB/s-7410KiB/s (7588kB/s-7588kB/s), io=434MiB (455MB), run=60001-60001msec
Disk stats (read/write):
sda: ios=258717/89376, merge=0/735, ticks=52540/564186, in_queue=616999, util=90.07%

ESSD磁盘测试数据

这是一块虚拟的阿里云网络盘,不能算完整意义的SSD(承诺IOPS 4200),数据仅供参考,磁盘概况:

1
2
3
4
5
6
$df -lh
Filesystem Size Used Avail Use% Mounted on
/dev/vda1 99G 30G 65G 32% /
$cat /sys/block/vda/queue/rotational
1

测试数据:

1
2
3
4
5
6
7
8
9
10
11
12
13
14
15
16
17
18
19
20
21
22
23
24
25
26
27
28
29
30
31
32
33
34
35
36
37
38
39
40
41
42
43
44
45
46
47
48
49
50
51
52
53
54
55
56
57
58
59
60
61
62
63
64
65
66
67
68
69
70
71
72
73
74
75
76
77
78
79
80
81
82
83
84
85
86
87
88
89
90
91
92
93
94
95
96
97
98
99
100
101
102
103
104
105
106
107
108
109
110
111
112
113
114
115
116
117
118
119
120
121
122
123
124
125
126
127
128
129
130
131
132
133
134
135
136
137
138
139
140
141
142
143
144
145
146
147
148
149
150
151
152
153
154
155
156
157
158
159
160
161
162
163
164
165
166
167
168
169
170
171
172
173
174
175
176
177
178
179
180
181
182
183
184
185
186
187
188
$fio -ioengine=libaio -bs=4k -direct=1 -buffered=1 -thread -rw=randrw -size=4G -filename=/home/admin/fio.test -name="EBS 4K randwrite test" -iodepth=64 -runtime=60
EBS 4K randwrite test: (g=0): rw=randrw, bs=(R) 4096B-4096B, (W) 4096B-4096B, (T) 4096B-4096B, ioengine=libaio, iodepth=64
fio-3.1
Starting 1 thread
Jobs: 1 (f=1): [m(1)][100.0%][r=10.8MiB/s,w=11.2MiB/s][r=2757,w=2876 IOPS][eta 00m:00s]
EBS 4K randwrite test: (groupid=0, jobs=1): err= 0: pid=25641: Tue Feb 23 16:35:19 2021
read: IOPS=2136, BW=8545KiB/s (8750kB/s)(501MiB/60001msec)
slat (usec): min=190, max=830992, avg=457.20, stdev=3088.80
clat (nsec): min=1792, max=1721.3M, avg=14657528.60, stdev=63188988.75
lat (usec): min=344, max=1751.1k, avg=15115.20, stdev=65165.80
clat percentiles (msec):
| 1.00th=[ 8], 5.00th=[ 9], 10.00th=[ 9], 20.00th=[ 10],
| 30.00th=[ 10], 40.00th=[ 11], 50.00th=[ 11], 60.00th=[ 11],
| 70.00th=[ 12], 80.00th=[ 12], 90.00th=[ 13], 95.00th=[ 14],
| 99.00th=[ 17], 99.50th=[ 53], 99.90th=[ 1028], 99.95th=[ 1167],
| 99.99th=[ 1653]
bw ( KiB/s): min= 56, max=12648, per=100.00%, avg=8598.92, stdev=5289.40, samples=118
iops : min= 14, max= 3162, avg=2149.73, stdev=1322.35, samples=118
write: IOPS=2137, BW=8548KiB/s (8753kB/s)(501MiB/60001msec)
slat (usec): min=2, max=181, avg= 6.67, stdev= 7.22
clat (usec): min=628, max=1721.1k, avg=14825.32, stdev=65017.66
lat (usec): min=636, max=1721.1k, avg=14832.10, stdev=65018.10
clat percentiles (msec):
| 1.00th=[ 8], 5.00th=[ 9], 10.00th=[ 9], 20.00th=[ 10],
| 30.00th=[ 10], 40.00th=[ 11], 50.00th=[ 11], 60.00th=[ 11],
| 70.00th=[ 12], 80.00th=[ 12], 90.00th=[ 13], 95.00th=[ 14],
| 99.00th=[ 17], 99.50th=[ 53], 99.90th=[ 1045], 99.95th=[ 1200],
| 99.99th=[ 1687]
bw ( KiB/s): min= 72, max=13304, per=100.00%, avg=8602.99, stdev=5296.31, samples=118
iops : min= 18, max= 3326, avg=2150.75, stdev=1324.08, samples=118
lat (usec) : 2=0.01%, 500=0.01%, 750=0.01%
lat (msec) : 2=0.01%, 4=0.01%, 10=37.85%, 20=61.53%, 50=0.10%
lat (msec) : 100=0.06%, 250=0.03%, 500=0.01%, 750=0.03%, 1000=0.25%
lat (msec) : 2000=0.14%
cpu : usr=0.70%, sys=4.01%, ctx=135029, majf=0, minf=4
IO depths : 1=0.1%, 2=0.1%, 4=0.1%, 8=0.1%, 16=0.1%, 32=0.1%, >=64=100.0%
submit : 0=0.0%, 4=100.0%, 8=0.0%, 16=0.0%, 32=0.0%, 64=0.0%, >=64=0.0%
complete : 0=0.0%, 4=100.0%, 8=0.0%, 16=0.0%, 32=0.0%, 64=0.1%, >=64=0.0%
issued rwt: total=128180,128223,0, short=0,0,0, dropped=0,0,0
latency : target=0, window=0, percentile=100.00%, depth=64
Run status group 0 (all jobs):
READ: bw=8545KiB/s (8750kB/s), 8545KiB/s-8545KiB/s (8750kB/s-8750kB/s), io=501MiB (525MB), run=60001-60001msec
WRITE: bw=8548KiB/s (8753kB/s), 8548KiB/s-8548KiB/s (8753kB/s-8753kB/s), io=501MiB (525MB), run=60001-60001msec
Disk stats (read/write):
vda: ios=127922/87337, merge=0/237, ticks=55122/4269885, in_queue=2209125, util=94.29%
$fio -ioengine=libaio -bs=4k -direct=1 -buffered=0 -thread -rw=randrw -size=4G -filename=/home/admin/fio.test -name="EBS 4K randwrite test" -iodepth=64 -runtime=60
EBS 4K randwrite test: (g=0): rw=randrw, bs=(R) 4096B-4096B, (W) 4096B-4096B, (T) 4096B-4096B, ioengine=libaio, iodepth=64
fio-3.1
Starting 1 thread
Jobs: 1 (f=1): [m(1)][100.0%][r=9680KiB/s,w=9712KiB/s][r=2420,w=2428 IOPS][eta 00m:00s]
EBS 4K randwrite test: (groupid=0, jobs=1): err= 0: pid=25375: Tue Feb 23 16:33:03 2021
read: IOPS=2462, BW=9849KiB/s (10.1MB/s)(577MiB/60011msec)
slat (nsec): min=1558, max=10663k, avg=5900.28, stdev=46286.64
clat (usec): min=290, max=93493, avg=13054.57, stdev=4301.89
lat (usec): min=332, max=93497, avg=13060.60, stdev=4301.68
clat percentiles (usec):
| 1.00th=[ 1844], 5.00th=[10159], 10.00th=[10290], 20.00th=[10421],
| 30.00th=[10552], 40.00th=[10552], 50.00th=[10683], 60.00th=[10814],
| 70.00th=[18482], 80.00th=[19006], 90.00th=[19006], 95.00th=[19268],
| 99.00th=[19530], 99.50th=[19792], 99.90th=[29492], 99.95th=[30278],
| 99.99th=[43779]
bw ( KiB/s): min= 9128, max=30392, per=100.00%, avg=9850.12, stdev=1902.00, samples=120
iops : min= 2282, max= 7598, avg=2462.52, stdev=475.50, samples=120
write: IOPS=2465, BW=9864KiB/s (10.1MB/s)(578MiB/60011msec)
slat (usec): min=2, max=10586, avg= 6.92, stdev=67.34
clat (usec): min=240, max=69922, avg=12902.33, stdev=4307.92
lat (usec): min=244, max=69927, avg=12909.37, stdev=4307.03
clat percentiles (usec):
| 1.00th=[ 1729], 5.00th=[10159], 10.00th=[10290], 20.00th=[10290],
| 30.00th=[10421], 40.00th=[10421], 50.00th=[10552], 60.00th=[10683],
| 70.00th=[18220], 80.00th=[18744], 90.00th=[19006], 95.00th=[19006],
| 99.00th=[19268], 99.50th=[19530], 99.90th=[21103], 99.95th=[35390],
| 99.99th=[50594]
bw ( KiB/s): min= 8496, max=31352, per=100.00%, avg=9862.92, stdev=1991.48, samples=120
iops : min= 2124, max= 7838, avg=2465.72, stdev=497.87, samples=120
lat (usec) : 250=0.01%, 500=0.03%, 750=0.02%, 1000=0.02%
lat (msec) : 2=1.70%, 4=0.41%, 10=1.25%, 20=96.22%, 50=0.34%
lat (msec) : 100=0.01%
cpu : usr=0.89%, sys=4.09%, ctx=206337, majf=0, minf=4
IO depths : 1=0.1%, 2=0.1%, 4=0.1%, 8=0.1%, 16=0.1%, 32=0.1%, >=64=100.0%
submit : 0=0.0%, 4=100.0%, 8=0.0%, 16=0.0%, 32=0.0%, 64=0.0%, >=64=0.0%
complete : 0=0.0%, 4=100.0%, 8=0.0%, 16=0.0%, 32=0.0%, 64=0.1%, >=64=0.0%
issued rwt: total=147768,147981,0, short=0,0,0, dropped=0,0,0
latency : target=0, window=0, percentile=100.00%, depth=64
Run status group 0 (all jobs):
READ: bw=9849KiB/s (10.1MB/s), 9849KiB/s-9849KiB/s (10.1MB/s-10.1MB/s), io=577MiB (605MB), run=60011-60011msec
WRITE: bw=9864KiB/s (10.1MB/s), 9864KiB/s-9864KiB/s (10.1MB/s-10.1MB/s), io=578MiB (606MB), run=60011-60011msec
Disk stats (read/write):
vda: ios=147515/148154, merge=0/231, ticks=1922378/1915751, in_queue=3780605, util=98.46%
$fio -ioengine=libaio -bs=4k -direct=0 -buffered=1 -thread -rw=randrw -size=4G -filename=/home/admin/fio.test -name="EBS 4K randwrite test" -iodepth=64 -runtime=60
EBS 4K randwrite test: (g=0): rw=randrw, bs=(R) 4096B-4096B, (W) 4096B-4096B, (T) 4096B-4096B, ioengine=libaio, iodepth=64
fio-3.1
Starting 1 thread
Jobs: 1 (f=1): [m(1)][100.0%][r=132KiB/s,w=148KiB/s][r=33,w=37 IOPS][eta 00m:00s]
EBS 4K randwrite test: (groupid=0, jobs=1): err= 0: pid=25892: Tue Feb 23 16:37:41 2021
read: IOPS=1987, BW=7949KiB/s (8140kB/s)(467MiB/60150msec)
slat (usec): min=192, max=599873, avg=479.26, stdev=2917.52
clat (usec): min=15, max=1975.6k, avg=16004.22, stdev=76024.60
lat (msec): min=5, max=2005, avg=16.48, stdev=78.00
clat percentiles (msec):
| 1.00th=[ 8], 5.00th=[ 9], 10.00th=[ 9], 20.00th=[ 10],
| 30.00th=[ 10], 40.00th=[ 11], 50.00th=[ 11], 60.00th=[ 11],
| 70.00th=[ 12], 80.00th=[ 12], 90.00th=[ 13], 95.00th=[ 14],
| 99.00th=[ 19], 99.50th=[ 317], 99.90th=[ 1133], 99.95th=[ 1435],
| 99.99th=[ 1871]
bw ( KiB/s): min= 32, max=12672, per=100.00%, avg=8034.08, stdev=5399.63, samples=119
iops : min= 8, max= 3168, avg=2008.52, stdev=1349.91, samples=119
write: IOPS=1984, BW=7937KiB/s (8127kB/s)(466MiB/60150msec)
slat (usec): min=2, max=839634, avg=18.39, stdev=2747.10
clat (msec): min=5, max=1975, avg=15.64, stdev=73.06
lat (msec): min=5, max=1975, avg=15.66, stdev=73.28
clat percentiles (msec):
| 1.00th=[ 8], 5.00th=[ 9], 10.00th=[ 9], 20.00th=[ 10],
| 30.00th=[ 10], 40.00th=[ 11], 50.00th=[ 11], 60.00th=[ 11],
| 70.00th=[ 12], 80.00th=[ 12], 90.00th=[ 13], 95.00th=[ 14],
| 99.00th=[ 18], 99.50th=[ 153], 99.90th=[ 1116], 99.95th=[ 1435],
| 99.99th=[ 1921]
bw ( KiB/s): min= 24, max=13160, per=100.00%, avg=8021.18, stdev=5405.12, samples=119
iops : min= 6, max= 3290, avg=2005.29, stdev=1351.28, samples=119
lat (usec) : 20=0.01%
lat (msec) : 10=36.51%, 20=62.63%, 50=0.21%, 100=0.12%, 250=0.05%
lat (msec) : 500=0.02%, 750=0.02%, 1000=0.19%, 2000=0.26%
cpu : usr=0.62%, sys=4.04%, ctx=125974, majf=0, minf=3
IO depths : 1=0.1%, 2=0.1%, 4=0.1%, 8=0.1%, 16=0.1%, 32=0.1%, >=64=100.0%
submit : 0=0.0%, 4=100.0%, 8=0.0%, 16=0.0%, 32=0.0%, 64=0.0%, >=64=0.0%
complete : 0=0.0%, 4=100.0%, 8=0.0%, 16=0.0%, 32=0.0%, 64=0.1%, >=64=0.0%
issued rwt: total=119533,119347,0, short=0,0,0, dropped=0,0,0
latency : target=0, window=0, percentile=100.00%, depth=64
Run status group 0 (all jobs):
READ: bw=7949KiB/s (8140kB/s), 7949KiB/s-7949KiB/s (8140kB/s-8140kB/s), io=467MiB (490MB), run=60150-60150msec
WRITE: bw=7937KiB/s (8127kB/s), 7937KiB/s-7937KiB/s (8127kB/s-8127kB/s), io=466MiB (489MB), run=60150-60150msec
Disk stats (read/write):
vda: ios=119533/108186, merge=0/214, ticks=54093/4937255, in_queue=2525052, util=93.99%
$fio -ioengine=libaio -bs=4k -direct=0 -buffered=0 -thread -rw=randrw -size=4G -filename=/home/admin/fio.test -name="EBS 4K randwrite test" -iodepth=64 -runtime=60
EBS 4K randwrite test: (g=0): rw=randrw, bs=(R) 4096B-4096B, (W) 4096B-4096B, (T) 4096B-4096B, ioengine=libaio, iodepth=64
fio-3.1
Starting 1 thread
Jobs: 1 (f=1): [m(1)][100.0%][r=9644KiB/s,w=9792KiB/s][r=2411,w=2448 IOPS][eta 00m:00s]
EBS 4K randwrite test: (groupid=0, jobs=1): err= 0: pid=26139: Tue Feb 23 16:39:43 2021
read: IOPS=2455, BW=9823KiB/s (10.1MB/s)(576MiB/60015msec)
slat (nsec): min=1619, max=18282k, avg=5882.81, stdev=71214.52
clat (usec): min=281, max=64630, avg=13055.68, stdev=4233.17
lat (usec): min=323, max=64636, avg=13061.69, stdev=4232.79
clat percentiles (usec):
| 1.00th=[ 2040], 5.00th=[10290], 10.00th=[10421], 20.00th=[10421],
| 30.00th=[10552], 40.00th=[10552], 50.00th=[10683], 60.00th=[10814],
| 70.00th=[18220], 80.00th=[19006], 90.00th=[19006], 95.00th=[19268],
| 99.00th=[19530], 99.50th=[20055], 99.90th=[28967], 99.95th=[29754],
| 99.99th=[30540]
bw ( KiB/s): min= 8776, max=27648, per=100.00%, avg=9824.29, stdev=1655.78, samples=120
iops : min= 2194, max= 6912, avg=2456.05, stdev=413.95, samples=120
write: IOPS=2458, BW=9835KiB/s (10.1MB/s)(576MiB/60015msec)
slat (usec): min=2, max=10681, avg= 6.79, stdev=71.30
clat (usec): min=221, max=70411, avg=12909.50, stdev=4312.40
lat (usec): min=225, max=70414, avg=12916.40, stdev=4312.05
clat percentiles (usec):
| 1.00th=[ 1909], 5.00th=[10159], 10.00th=[10290], 20.00th=[10290],
| 30.00th=[10421], 40.00th=[10421], 50.00th=[10552], 60.00th=[10683],
| 70.00th=[18220], 80.00th=[18744], 90.00th=[19006], 95.00th=[19006],
| 99.00th=[19268], 99.50th=[19530], 99.90th=[28705], 99.95th=[40109],
| 99.99th=[60031]
bw ( KiB/s): min= 8568, max=28544, per=100.00%, avg=9836.03, stdev=1737.29, samples=120
iops : min= 2142, max= 7136, avg=2458.98, stdev=434.32, samples=120
lat (usec) : 250=0.01%, 500=0.03%, 750=0.02%, 1000=0.02%
lat (msec) : 2=1.03%, 4=1.10%, 10=0.98%, 20=96.43%, 50=0.38%
lat (msec) : 100=0.01%
cpu : usr=0.82%, sys=4.32%, ctx=212008, majf=0, minf=4
IO depths : 1=0.1%, 2=0.1%, 4=0.1%, 8=0.1%, 16=0.1%, 32=0.1%, >=64=100.0%
submit : 0=0.0%, 4=100.0%, 8=0.0%, 16=0.0%, 32=0.0%, 64=0.0%, >=64=0.0%
complete : 0=0.0%, 4=100.0%, 8=0.0%, 16=0.0%, 32=0.0%, 64=0.1%, >=64=0.0%
issued rwt: total=147386,147564,0, short=0,0,0, dropped=0,0,0
latency : target=0, window=0, percentile=100.00%, depth=64
Run status group 0 (all jobs):
READ: bw=9823KiB/s (10.1MB/s), 9823KiB/s-9823KiB/s (10.1MB/s-10.1MB/s), io=576MiB (604MB), run=60015-60015msec
WRITE: bw=9835KiB/s (10.1MB/s), 9835KiB/s-9835KiB/s (10.1MB/s-10.1MB/s), io=576MiB (604MB), run=60015-60015msec
Disk stats (read/write):
vda: ios=147097/147865, merge=0/241, ticks=1916703/1915836, in_queue=3791443, util=98.68%

测试数据总结

-direct=1 -buffered=1 -direct=1 -buffered=0 -direct=0 -buffered=0 -direct=0 -buffered=1
NVMe SSD R=10.6k W=4544 R=99.8K W=42.8K R=38.6k W=16.5k R=10.8K W=4642
SATA SSD R=4312 W=1852 R=16.9k W=7254 R=15.8k W=6803 R=5389 W=2314
ESSD R=2149 W=2150 R=2462 W=2465 R=2455 W=2458 R=1987 W=1984

看起来,对于SSD如果buffered为1的话direct没啥用,如果buffered为0那么direct为1性能要好很多

SATA SSD的IOPS比NVMe性能差很多

SATA SSD当-buffered=1参数下SATA SSD的latency在7-10us之间。

NVMe SSD以及SATA SSD当buffered=0的条件下latency均为2-3us, NVMe SSD latency参考文章第一个表格, 和本次NVMe测试结果一致.

ESSD的latency基本是13-16us。

以上NVMe SSD测试数据是在测试过程中还有mysql在全力导入数据的情况下,用fio测试所得。所以空闲情况下测试结果会更好。

HDD性能测试数据

img

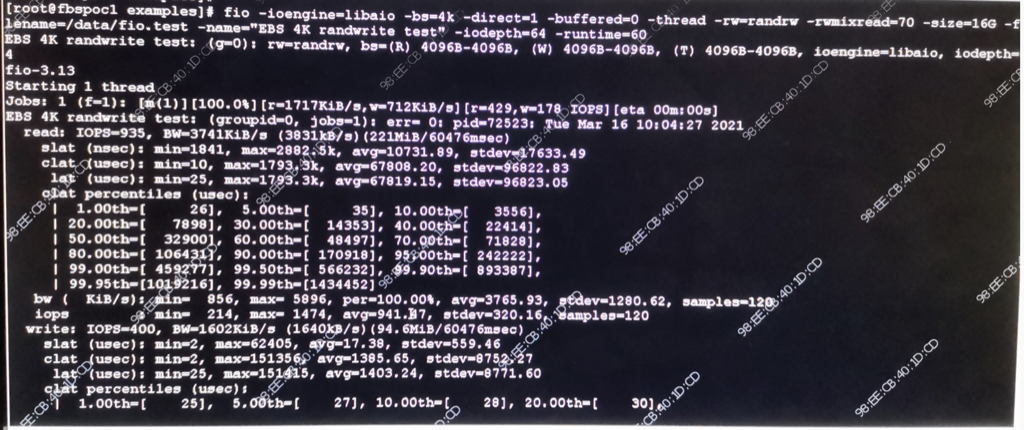
从上图可以看到这个磁盘的IOPS 读 935 写 400,读rt 10731nsec 大约10us, 写 17us。如果IOPS是1000的话,rt应该是1ms,实际比1ms小两个数量级,应该是cache、磁盘阵列在起作用。

SATA硬盘,10K转

万转机械硬盘组成RAID5阵列,在顺序条件最好的情况下,带宽可以达到1GB/s以上,平均延时也非常低,最低只有20多us。但是在随机IO的情况下,机械硬盘的短板就充分暴露了,零点几兆的带宽,将近5ms的延迟,IOPS只有200左右。其原因是因为

  • 随机访问直接让RAID卡缓存成了个摆设
  • 磁盘不能并行工作,因为我的机器RAID宽度Strip Size为128 KB
  • 机械轴也得在各个磁道之间跳来跳去。

理解了磁盘顺序IO时候的几十M甚至一个GB的带宽,随机IO这个真的是太可怜了。

从上面的测试数据中我们看到了机械硬盘在顺序IO和随机IO下的巨大性能差异。在顺序IO情况下,磁盘是最擅长的顺序IO,再加上Raid卡缓存命中率也高。这时带宽表现有几十、几百M,最好条件下甚至能达到1GB。IOPS这时候能有2-3W左右。到了随机IO的情形下,机械轴也被逼的跳来跳去寻道,RAID卡缓存也失效了。带宽跌到了1MB以下,最低只有100K,IOPS也只有可怜巴巴的200左右。

网上测试数据参考

我们来一起看一下具体的数据。首先来看NVMe如何减小了协议栈本身的时间消耗,我们用blktrace工具来分析一组传输在应用程序层、操作系统层、驱动层和硬件层消耗的时间和占比,来了解AHCI和NVMe协议的性能区别:

img

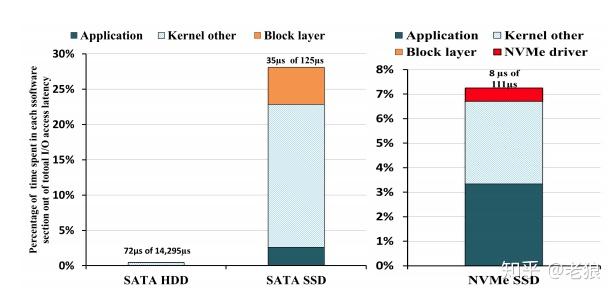
硬盘HDD作为一个参考基准,它的时延是非常大的,达到14ms,而AHCI SATA为125us,NVMe为111us。我们从图中可以看出,NVMe相对AHCI,协议栈及之下所占用的时间比重明显减小,应用程序层面等待的时间占比很高,这是因为SSD物理硬盘速度不够快,导致应用空转。NVMe也为将来Optane硬盘这种低延迟介质的速度提高留下了广阔的空间。
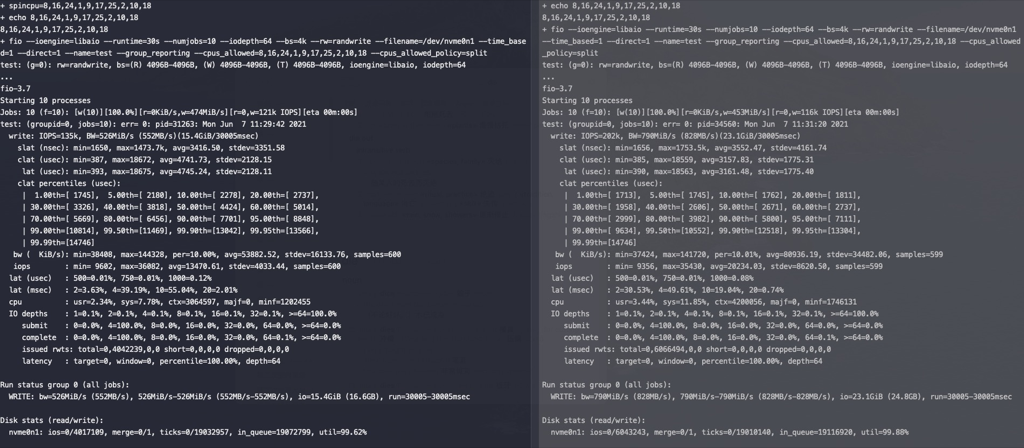
rq_affinity

参考aliyun测试文档 , rq_affinity增加2的commit: git show 5757a6d76c

1
2
3
4
5
6
7
8
9
10
11
12
13
14
15
16
17
18
19
20
21
22
23
24
25
26
27
28
29
function RunFio
{
numjobs=$1 # 实例中的测试线程数,例如示例中的10
iodepth=$2 # 同时发出I/O数的上限,例如示例中的64
bs=$3 # 单次I/O的块文件大小,例如示例中的4k
rw=$4 # 测试时的读写策略,例如示例中的randwrite
filename=$5 # 指定测试文件的名称,例如示例中的/dev/your_device
nr_cpus=`cat /proc/cpuinfo |grep "processor" |wc -l`
if [ $nr_cpus -lt $numjobs ];then
echo “Numjobs is more than cpu cores, exit!”
exit -1
fi
let nu=$numjobs+1
cpulist=""
for ((i=1;i<10;i++))
do
list=`cat /sys/block/your_device/mq/*/cpu_list | awk '{if(i<=NF) print $i;}' i="$i" | tr -d ',' | tr '\n' ','`
if [ -z $list ];then
break
fi
cpulist=${cpulist}${list}
done
spincpu=`echo $cpulist | cut -d ',' -f 2-${nu}`
echo $spincpu
fio --ioengine=libaio --runtime=30s --numjobs=${numjobs} --iodepth=${iodepth} --bs=${bs} --rw=${rw} --filename=${filename} --time_based=1 --direct=1 --name=test --group_reporting --cpus_allowed=$spincpu --cpus_allowed_policy=split
}
echo 2 > /sys/block/your_device/queue/rq_affinity
sleep 5
RunFio 10 64 4k randwrite filename

对NVME SSD进行测试,左边rq_affinity是2,右边rq_affinity为1,在这个测试参数下rq_affinity为1的性能要好(后许多次测试两者性能差不多)

image-20210607113709945

LVM性能对比

磁盘信息

1
2
3
4
5
6
7
8
9
10
11
12
13
14
15
16
#lsblk
NAME MAJ:MIN RM SIZE RO TYPE MOUNTPOINT
sda 8:0 0 223.6G 0 disk
├─sda1 8:1 0 3M 0 part
├─sda2 8:2 0 1G 0 part /boot
├─sda3 8:3 0 96G 0 part /
├─sda4 8:4 0 10G 0 part /tmp
└─sda5 8:5 0 116.6G 0 part /home
nvme0n1 259:4 0 2.7T 0 disk
└─nvme0n1p1 259:5 0 2.7T 0 part
└─vg1-drds 252:0 0 5.4T 0 lvm /drds
nvme1n1 259:0 0 2.7T 0 disk
└─nvme1n1p1 259:2 0 2.7T 0 part /u02
nvme2n1 259:1 0 2.7T 0 disk
└─nvme2n1p1 259:3 0 2.7T 0 part
└─vg1-drds 252:0 0 5.4T 0 lvm /drds

单块nvme SSD盘跑mysql server,运行sysbench导入测试数据

1
2
3
4
5
6
7
8
9
10
11
12
13
14
15
16
17
18
19
20
21
22
23
24
25
26
27
28
29
30
31
32
33
34
35
36
37
38
39
40
41
42
43
44
45
46
47
48
49
50
51
52
53
54
55
56
57
#iostat -x nvme1n1 1
Linux 3.10.0-327.ali2017.alios7.x86_64 (k28a11352.eu95sqa) 05/13/2021 _x86_64_ (64 CPU)
avg-cpu: %user %nice %system %iowait %steal %idle
0.32 0.00 0.17 0.07 0.00 99.44
Device: rrqm/s wrqm/s r/s w/s rkB/s wkB/s avgrq-sz avgqu-sz await r_await w_await svctm %util
nvme1n1 0.00 47.19 0.19 445.15 2.03 43110.89 193.62 0.31 0.70 0.03 0.70 0.06 2.85
avg-cpu: %user %nice %system %iowait %steal %idle
1.16 0.00 0.36 0.17 0.00 98.31
Device: rrqm/s wrqm/s r/s w/s rkB/s wkB/s avgrq-sz avgqu-sz await r_await w_await svctm %util
nvme1n1 0.00 122.00 0.00 3290.00 0.00 271052.00 164.77 1.65 0.50 0.00 0.50 0.05 17.00
#iostat 1
Linux 3.10.0-327.ali2017.alios7.x86_64 (k28a11352.eu95sqa) 05/13/2021 _x86_64_ (64 CPU)
avg-cpu: %user %nice %system %iowait %steal %idle
0.14 0.00 0.13 0.05 0.00 99.67
Device: tps kB_read/s kB_wrtn/s kB_read kB_wrtn
sda 49.21 554.51 2315.83 1416900 5917488
nvme1n1 5.65 2.34 844.73 5989 2158468
nvme2n1 0.06 1.13 0.00 2896 0
nvme0n1 0.06 1.13 0.00 2900 0
dm-0 0.02 0.41 0.00 1036 0
avg-cpu: %user %nice %system %iowait %steal %idle
1.39 0.00 0.23 0.08 0.00 98.30
Device: tps kB_read/s kB_wrtn/s kB_read kB_wrtn
sda 8.00 0.00 60.00 0 60
nvme1n1 868.00 0.00 132100.00 0 132100
nvme2n1 0.00 0.00 0.00 0 0
nvme0n1 0.00 0.00 0.00 0 0
dm-0 0.00 0.00 0.00 0 0
avg-cpu: %user %nice %system %iowait %steal %idle
1.44 0.00 0.14 0.09 0.00 98.33
Device: tps kB_read/s kB_wrtn/s kB_read kB_wrtn
sda 0.00 0.00 0.00 0 0
nvme1n1 766.00 0.00 132780.00 0 132780
nvme2n1 0.00 0.00 0.00 0 0
nvme0n1 0.00 0.00 0.00 0 0
dm-0 0.00 0.00 0.00 0 0
avg-cpu: %user %nice %system %iowait %steal %idle
1.41 0.00 0.16 0.09 0.00 98.34
Device: tps kB_read/s kB_wrtn/s kB_read kB_wrtn
sda 105.00 0.00 532.00 0 532
nvme1n1 760.00 0.00 122236.00 0 122236
nvme2n1 0.00 0.00 0.00 0 0
nvme0n1 0.00 0.00 0.00 0 0
dm-0 0.00 0.00 0.00 0 0

如果同样写lvm,由两块nvme组成

1
2
3
4
5
6
7
8
9
10
11
12
13
14
15
16
17
18
19
20
21
22
23
24
25
26
27
28
29
30
31
32
33
34
35
36
37
38
39
40
41
42
43
44
45
46
47
48
49
50
51
Device: rrqm/s wrqm/s r/s w/s rkB/s wkB/s avgrq-sz avgqu-sz await r_await w_await svctm %util
nvme2n1 0.00 0.00 0.00 0.00 0.00 0.00 0.00 0.00 0.00 0.00 0.00 0.00 0.00
nvme0n1 0.00 137.00 0.00 5730.00 0.00 421112.00 146.98 2.95 0.52 0.00 0.52 0.05 27.30
avg-cpu: %user %nice %system %iowait %steal %idle
1.17 0.00 0.34 0.19 0.00 98.30
Device: rrqm/s wrqm/s r/s w/s rkB/s wkB/s avgrq-sz avgqu-sz await r_await w_await svctm %util
nvme2n1 0.00 0.00 0.00 0.00 0.00 0.00 0.00 0.00 0.00 0.00 0.00 0.00 0.00
nvme0n1 0.00 109.00 0.00 2533.00 0.00 271236.00 214.16 1.08 0.43 0.00 0.43 0.06 15.90
avg-cpu: %user %nice %system %iowait %steal %idle
1.38 0.00 0.42 0.20 0.00 98.00
Device: rrqm/s wrqm/s r/s w/s rkB/s wkB/s avgrq-sz avgqu-sz await r_await w_await svctm %util
nvme2n1 0.00 0.00 0.00 0.00 0.00 0.00 0.00 0.00 0.00 0.00 0.00 0.00 0.00
nvme0n1 0.00 118.00 0.00 3336.00 0.00 320708.00 192.27 1.50 0.45 0.00 0.45 0.06 20.00
[root@k28a11352.eu95sqa /var/lib]
#iostat 1
Linux 3.10.0-327.ali2017.alios7.x86_64 (k28a11352.eu95sqa) 05/13/2021 _x86_64_ (64 CPU)
avg-cpu: %user %nice %system %iowait %steal %idle
0.40 0.00 0.20 0.07 0.00 99.33
Device: tps kB_read/s kB_wrtn/s kB_read kB_wrtn
sda 38.96 334.64 1449.68 1419236 6148304
nvme1n1 324.95 1.43 31201.30 6069 132329072
nvme2n1 0.07 0.90 0.00 3808 0
nvme0n1 256.24 1.60 22918.46 6801 97200388
dm-0 266.98 1.38 22918.46 5849 97200388
avg-cpu: %user %nice %system %iowait %steal %idle
1.20 0.00 0.42 0.25 0.00 98.12
Device: tps kB_read/s kB_wrtn/s kB_read kB_wrtn
sda 0.00 0.00 0.00 0 0
nvme1n1 0.00 0.00 0.00 0 0
nvme2n1 0.00 0.00 0.00 0 0
nvme0n1 4460.00 0.00 332288.00 0 332288
dm-0 4608.00 0.00 332288.00 0 332288
avg-cpu: %user %nice %system %iowait %steal %idle
1.35 0.00 0.38 0.22 0.00 98.06
Device: tps kB_read/s kB_wrtn/s kB_read kB_wrtn
sda 48.00 0.00 200.00 0 200
nvme1n1 0.00 0.00 0.00 0 0
nvme2n1 0.00 0.00 0.00 0 0
nvme0n1 4187.00 0.00 332368.00 0 332368
dm-0 4348.00 0.00 332368.00 0 332368

不知道为什么只有一个块ssd有流量,可能跟只写一个文件有关系

SSD中,SATA、m2、PCIE和NVME各有什么意义

高速信号协议

SAS,SATA,PCIe 这三个是同一个层面上的,模拟串行高速接口。

  • SAS 对扩容比较友好,也支持双控双活。接上SAS RAID 卡,一般在阵列上用的比较多。
  • SATA 对热插拔很友好,早先台式机装机市场的 SSD基本上都是SATA的,现在的 机械硬盘也是SATA接口居多。但速率上最高只能到 6Gb/s,上限 768MB/s左右,现在已经慢慢被pcie取代。
  • PCIe 支持速率更高,也离CPU最近。很多设备 如 网卡,显卡也都走pcie接口,当然也有SSD。现在比较主流的是PCIe 3.0,8Gb/s 看起来好像也没比 SATA 高多少,但是 PCIe 支持多个LANE,每个LANE都是 8Gb/s,这样性能就倍数增加了。目前,SSD主流的是 PCIe 3.0x4 lane,性能可以做到 3500MB/s 左右。

传输层协议

SCSI,ATA,NVMe 都属于这一层。主要是定义命令集,数字逻辑层。

  • SCSI 命令集 历史悠久,应用也很广泛。U盘,SAS 盘,还有手机上 UFS 之类很多设备都走的这个命令集。
  • ATA 则只是跑在SATA 协议上
  • NVMe 协议是有特意为 NAND 进行优化。相比于上面两者,效率更高。主要是跑在 PCIe 上的。当然,也有NVMe-MI,NVMe-of之类的。是个很好的传输层协议。

物理接口

M.2 , U.2 , AIC, NGFF 这些属于物理接口

像 M.2 可以是 SATA SSD 也可以是 NVMe(PCIe) SSD。金手指上有一个 SATA/PCIe 的选择信号,来区分两者。很多笔记本的M.2 接口也是同时支持两种类型的盘的。

  • M.2 , 主要用在 笔记本上,优点是体积小,缺点是散热不好。

  • U.2,主要用在 数据中心或者一些企业级用户,对热插拔需求高的地方。优点热插拔,散热也不错。一般主要是pcie ssd(也有sas ssd),受限于接口,最多只能是 pcie 4lane

  • AIC,企业,行业用户用的比较多。通常会支持pcie 4lane/8lane,带宽上限更高

数据总结

  • 性能排序 NVMe SSD > SATA SSD > SAN > ESSD > HDD
  • 本地ssd性能最好、sas机械盘(RAID10)性能最差
  • san存储走特定的光纤网络,不是走tcp的san(至少从网卡看不到san的流量),性能居中
  • 从rt来看 ssd:san:sas 大概是 1:3:15
  • san比本地sas机械盘性能要好,这也许取决于san的网络传输性能和san存储中的设备(比如用的ssd而不是机械盘)
  • NVMe SSD比SATA SSD快很多,latency更稳定
  • 阿里云的云盘ESSD比本地SAS RAID10阵列性能还好

参考资料

http://cizixs.com/2017/01/03/how-slow-is-disk-and-network

https://tobert.github.io/post/2014-04-17-fio-output-explained.html

https://zhuanlan.zhihu.com/p/40497397

块存储NVMe云盘原型实践

机械硬盘随机IO慢的超乎你的想象

搭载固态硬盘的服务器究竟比搭机械硬盘快多少?